Dodgers Dataset Description
Type in the variable search term below:
| Variable | Description | Quanitative or Qualitative |
|---|---|---|
| Month | Month of the year | Qualitative |
| Day | Day of Month | Qualitative |
| Attend | Attendace at game | Quantitative |
| Opponent | Opponent played in game | Qualitative |
| Temp | Temperature at time of game | Quantitative |
| Day/Night | Time of game (day or night) | Qualitative |
| Cap | Cap given away (yes or no) | Qualitative |
| Shirt | Shirt given away (yes or no) | Qualitative |
| Fireworks | Fireworks used at game (yes or no) | Qualitative |
| Bobblehead | Bobblehead given away (yes or no) | Qualitative |
| Ordered day of week | Day of week (Mon, Tues, etc...) | Qualitative |
| Ordered Month | Month of year (Apr, Aug, etc...) | Qualitative |
| Temp (high/low) | Temperature (Cold, Mild, Hot) | Qualitative |
Dodgers' Dataset Visualizations
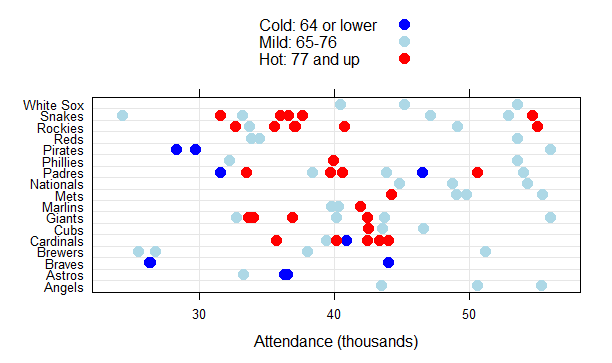
Temperature at time of game
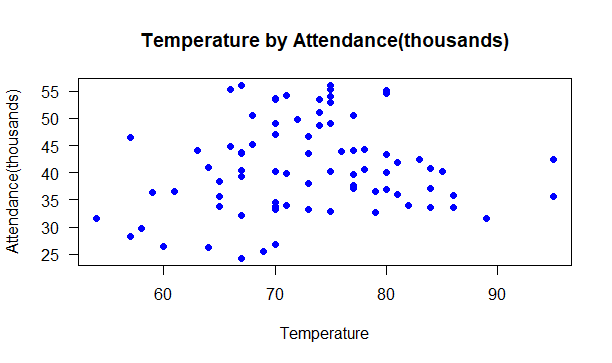
The temperature visualization shows that the temperature at the time of the game is a good indicator of the attendance by individuals at the game.
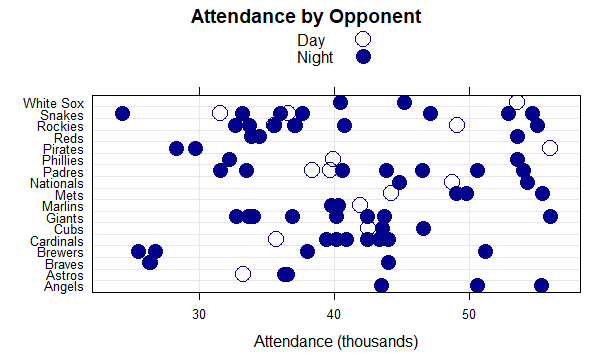
Attendance
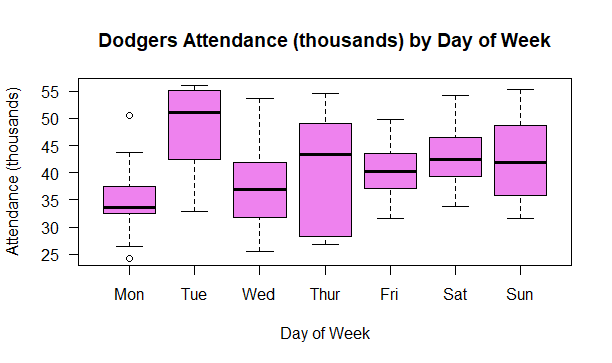
The attendance by day of week chart shows that the highest number of individuals attended games on Tuesdays.
Bobblehead Attendance
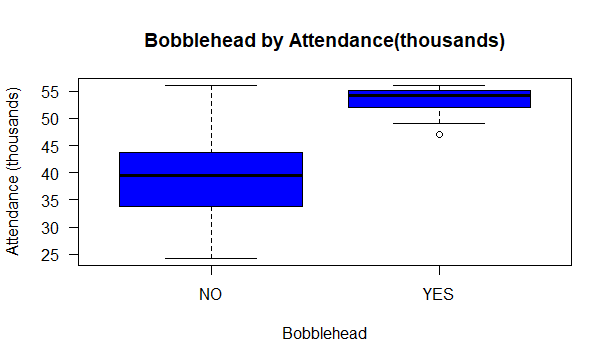
The bobblehead by attendance chart shows that more individuals attended games when a bobblehead was given away than if there was no bobblehead given away.
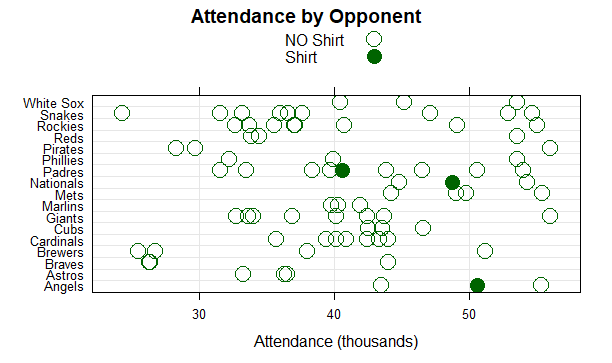
T-shirt Giveaway
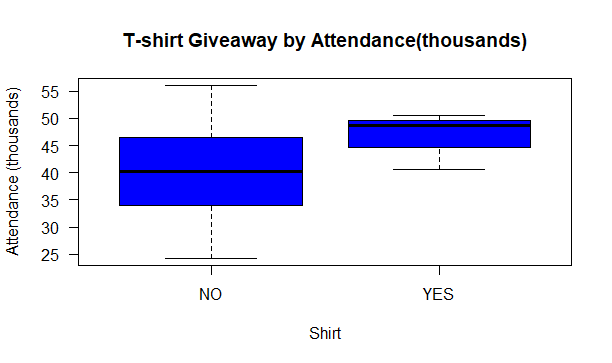
The t-shirt by attendance chart shows that individuals were more likely to attend a game if a tshirt was given away, versus if a t-shirt was not given away.
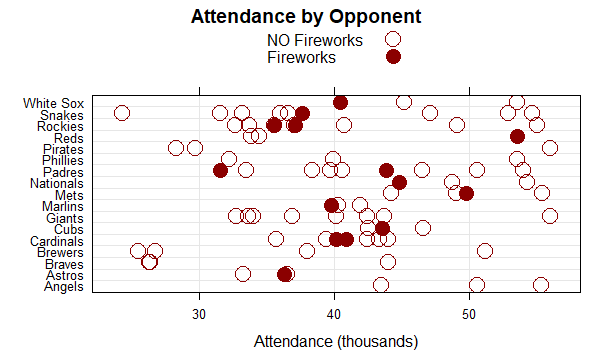
Fireworks at game
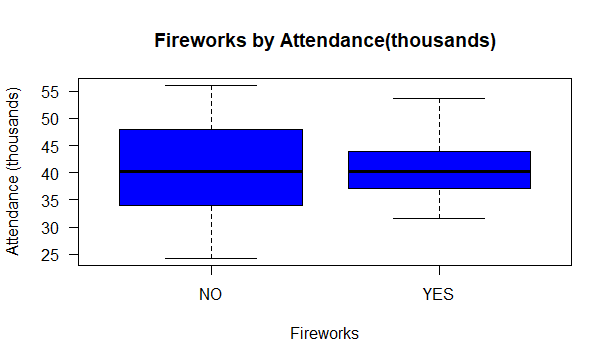
The fireworks by attendance chart shows that individuals were neither more nor less likely to attend a game with fireworks present. This may be due to fireworks being used on holidays, weekends, or after a win against certain teams.
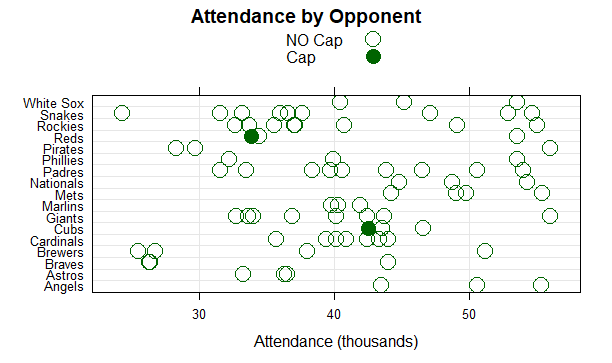
Baseball Caps given away
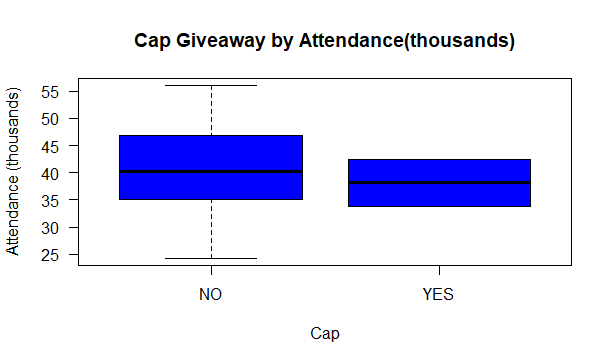
The cap by attendance chart shows that individuals were not more or less likely to attend a game if a cap was being given away at the game.
What days are promotions used?
Type in the variable search term below:
| Promotion Used | Mon | Tues | Wed | Thurs | Fri | Sat | Sun | Total Used |
|---|---|---|---|---|---|---|---|---|
| Bobblehead | 0 | 6 | 0 | 2 | 0 | 2 | 1 | 11 |
| Cap | 0 | 1 | 0 | 0 | 0 | 0 | 1 | 2 |
| Shirt | 1 | 1 | 0 | 0 | 0 | 0 | 1 | 3 |
| Fireworks | 0 | 0 | 1 | 0 | 13 | 0 | 0 | 14 |
| Total per Day | 1 | 8 | 1 | 2 | 13 | 2 | 3 | 31 |
The above table shows that the most used promotional item was fireworks on Fridays, but these were no more likely to affect attendance according to the previous charts. The next most giveaways were given away on Tuesday, and these were the bobblehead giveaways. This shows that bobblehead giveaways may affect attendance more than any other promotional item.
Dodgers Dataset: Conditional Variable Charts
Fireworks by Temperature
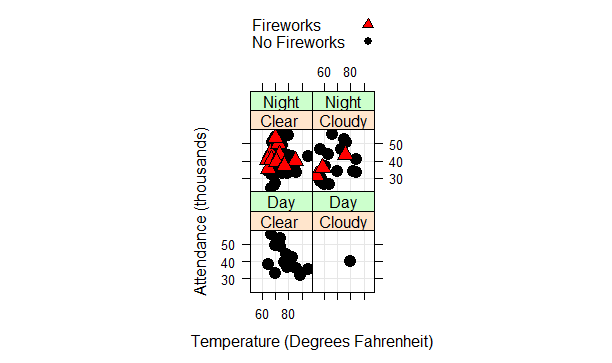
The fireworks chart shows that more individuals were likely to attend a night game with clear skies if fireworks were present than any other time of day or condition of the skies.
Cap giveaways by Temperature
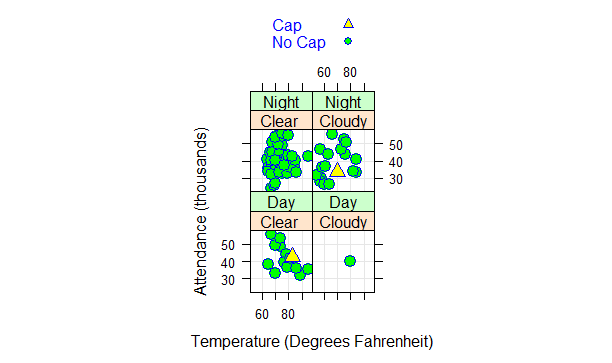
The cap chart shows that more individuals attended a game with a cap give away when the conditions were both day and the skies were clear.
T-shrit giveaways by Temperature
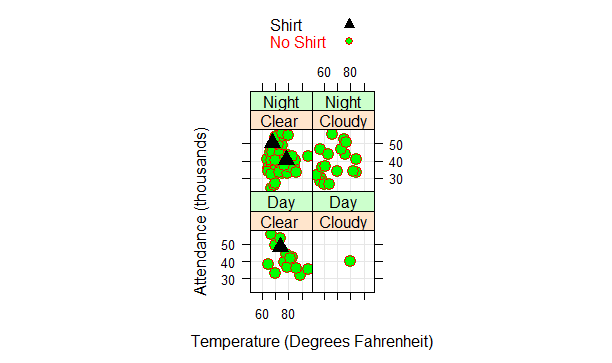
The shirt chart shows that more individuals attended a night game that had clear skies if a shirt was being given away.
T-shrit giveaways by Temperature
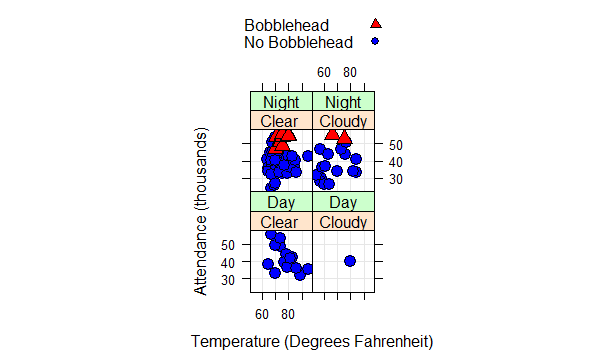
The bobblehead chart shows that more individuals attended either a night game whether it was clear or cloudy if a bobblehead was being given away. This chart also shows that bobblehead’s have an impact on the number of individuals who attend games.
Dodgers Lattice Plots